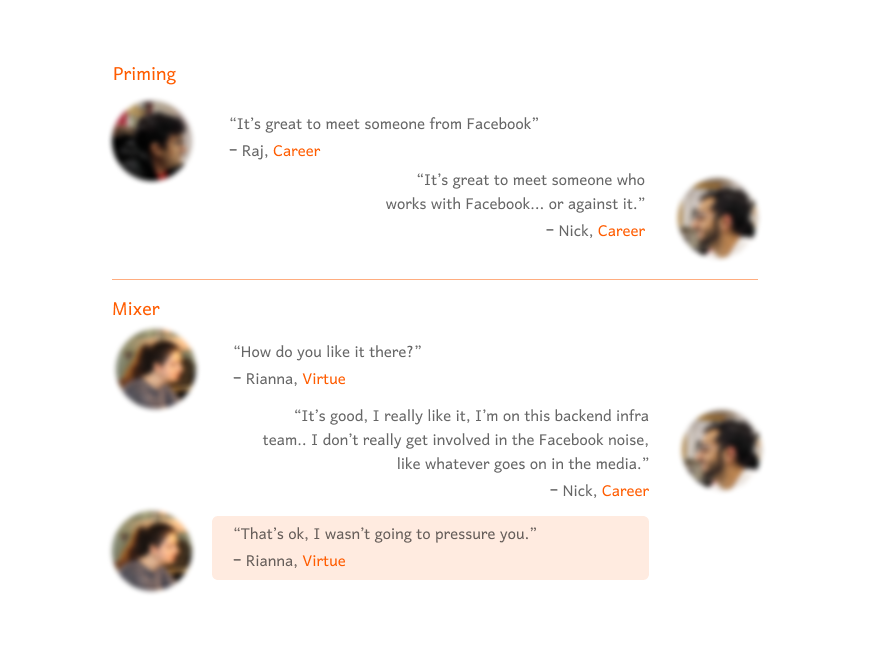
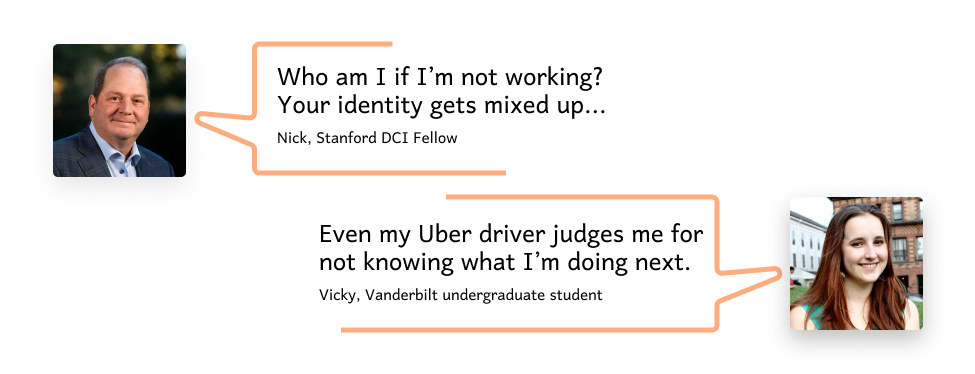
Figure 1: Quotes from interviews with over 20 retiring adults and 20 graduating college students
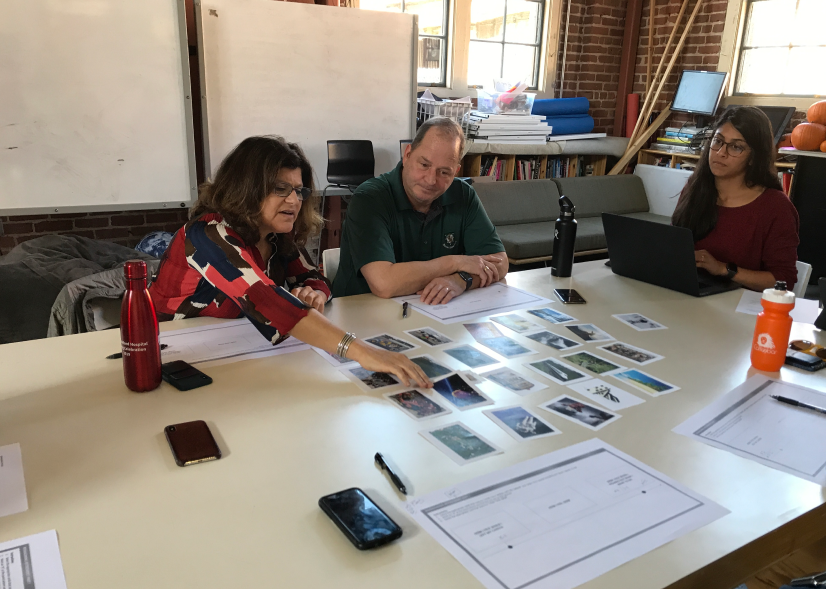
Figure 2: Running a card sorting exercise with retiring adults to map their journey
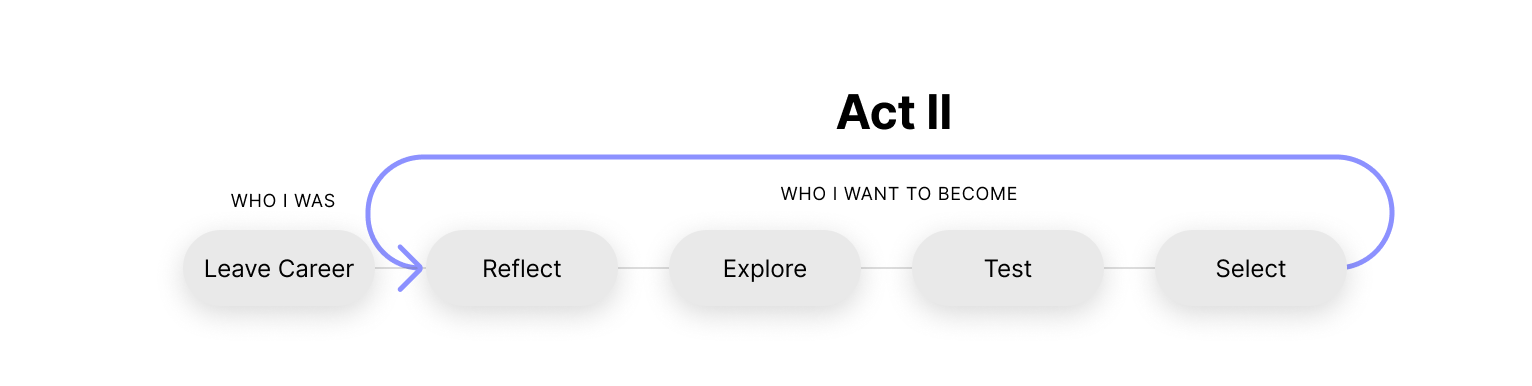
Figure 3: A simplified journey map reflecting participant responses from the card sorting exercise

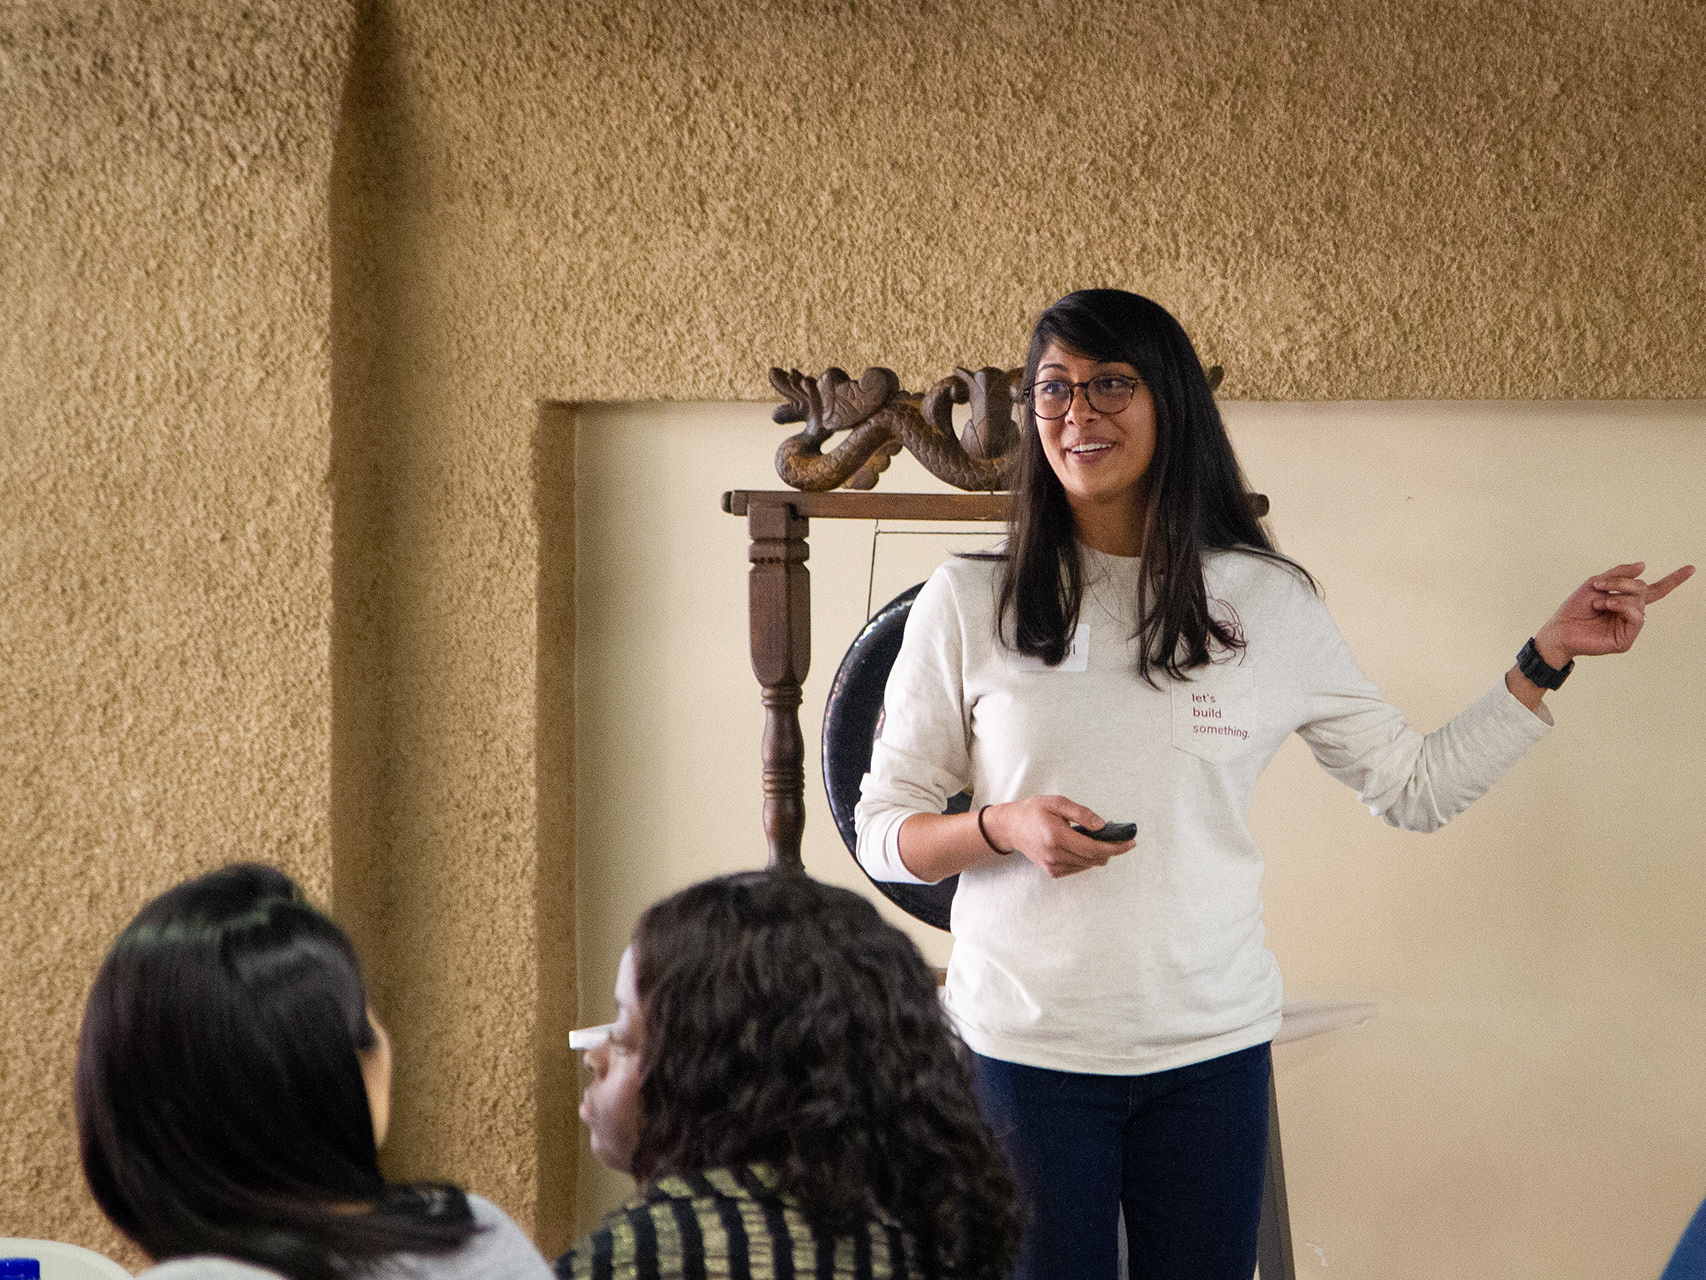
Figure 4: Step 1 in the retirement concierge prototype [Katie conducting an in-person Interests Quiz with a user]

Figure 5: Step 2 in the retirement concierge prototype [team brainstorm to curate experiences for Nick]
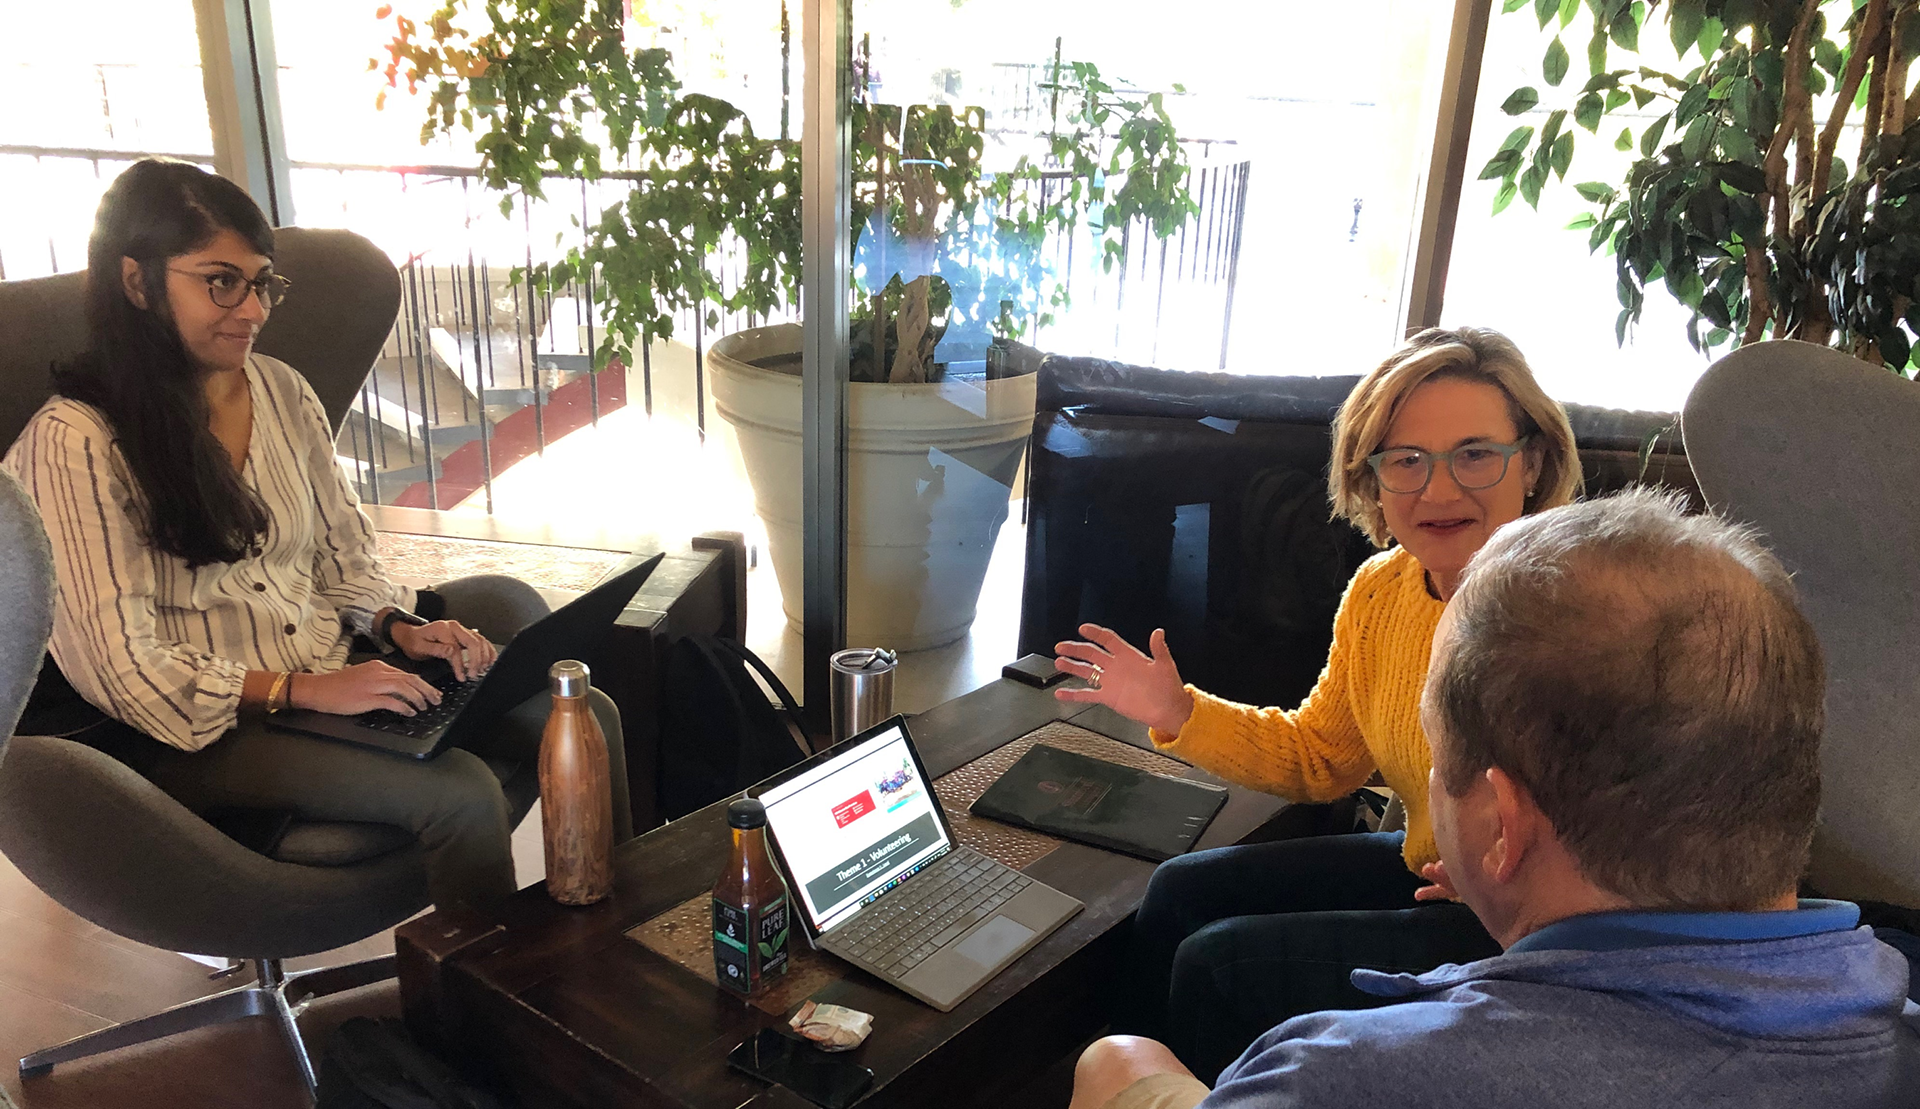
Figure 6: Step 3 in the retirement concierge prototype [presenting the experiences to the user]
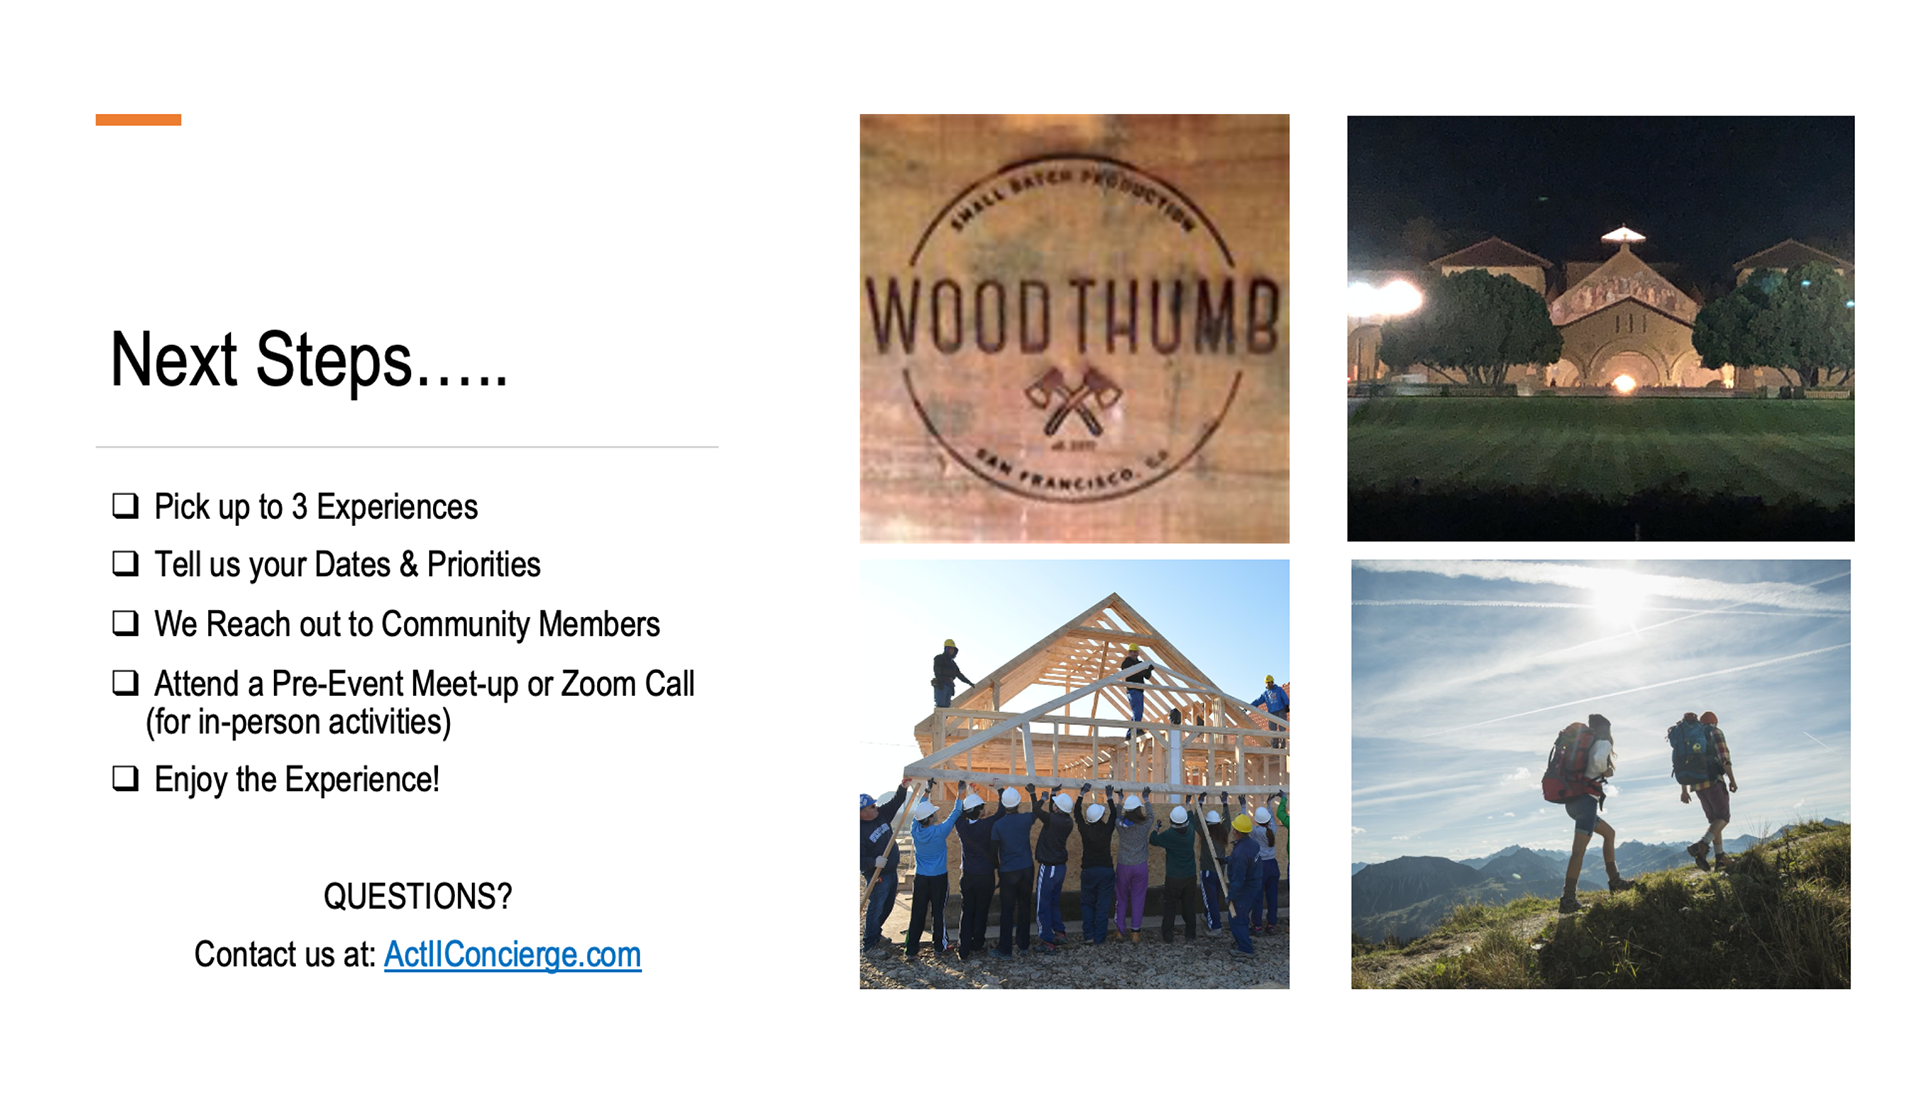
Figure 7: Step 4 in the retirement concierge prototype [asking the user to select their favorites]
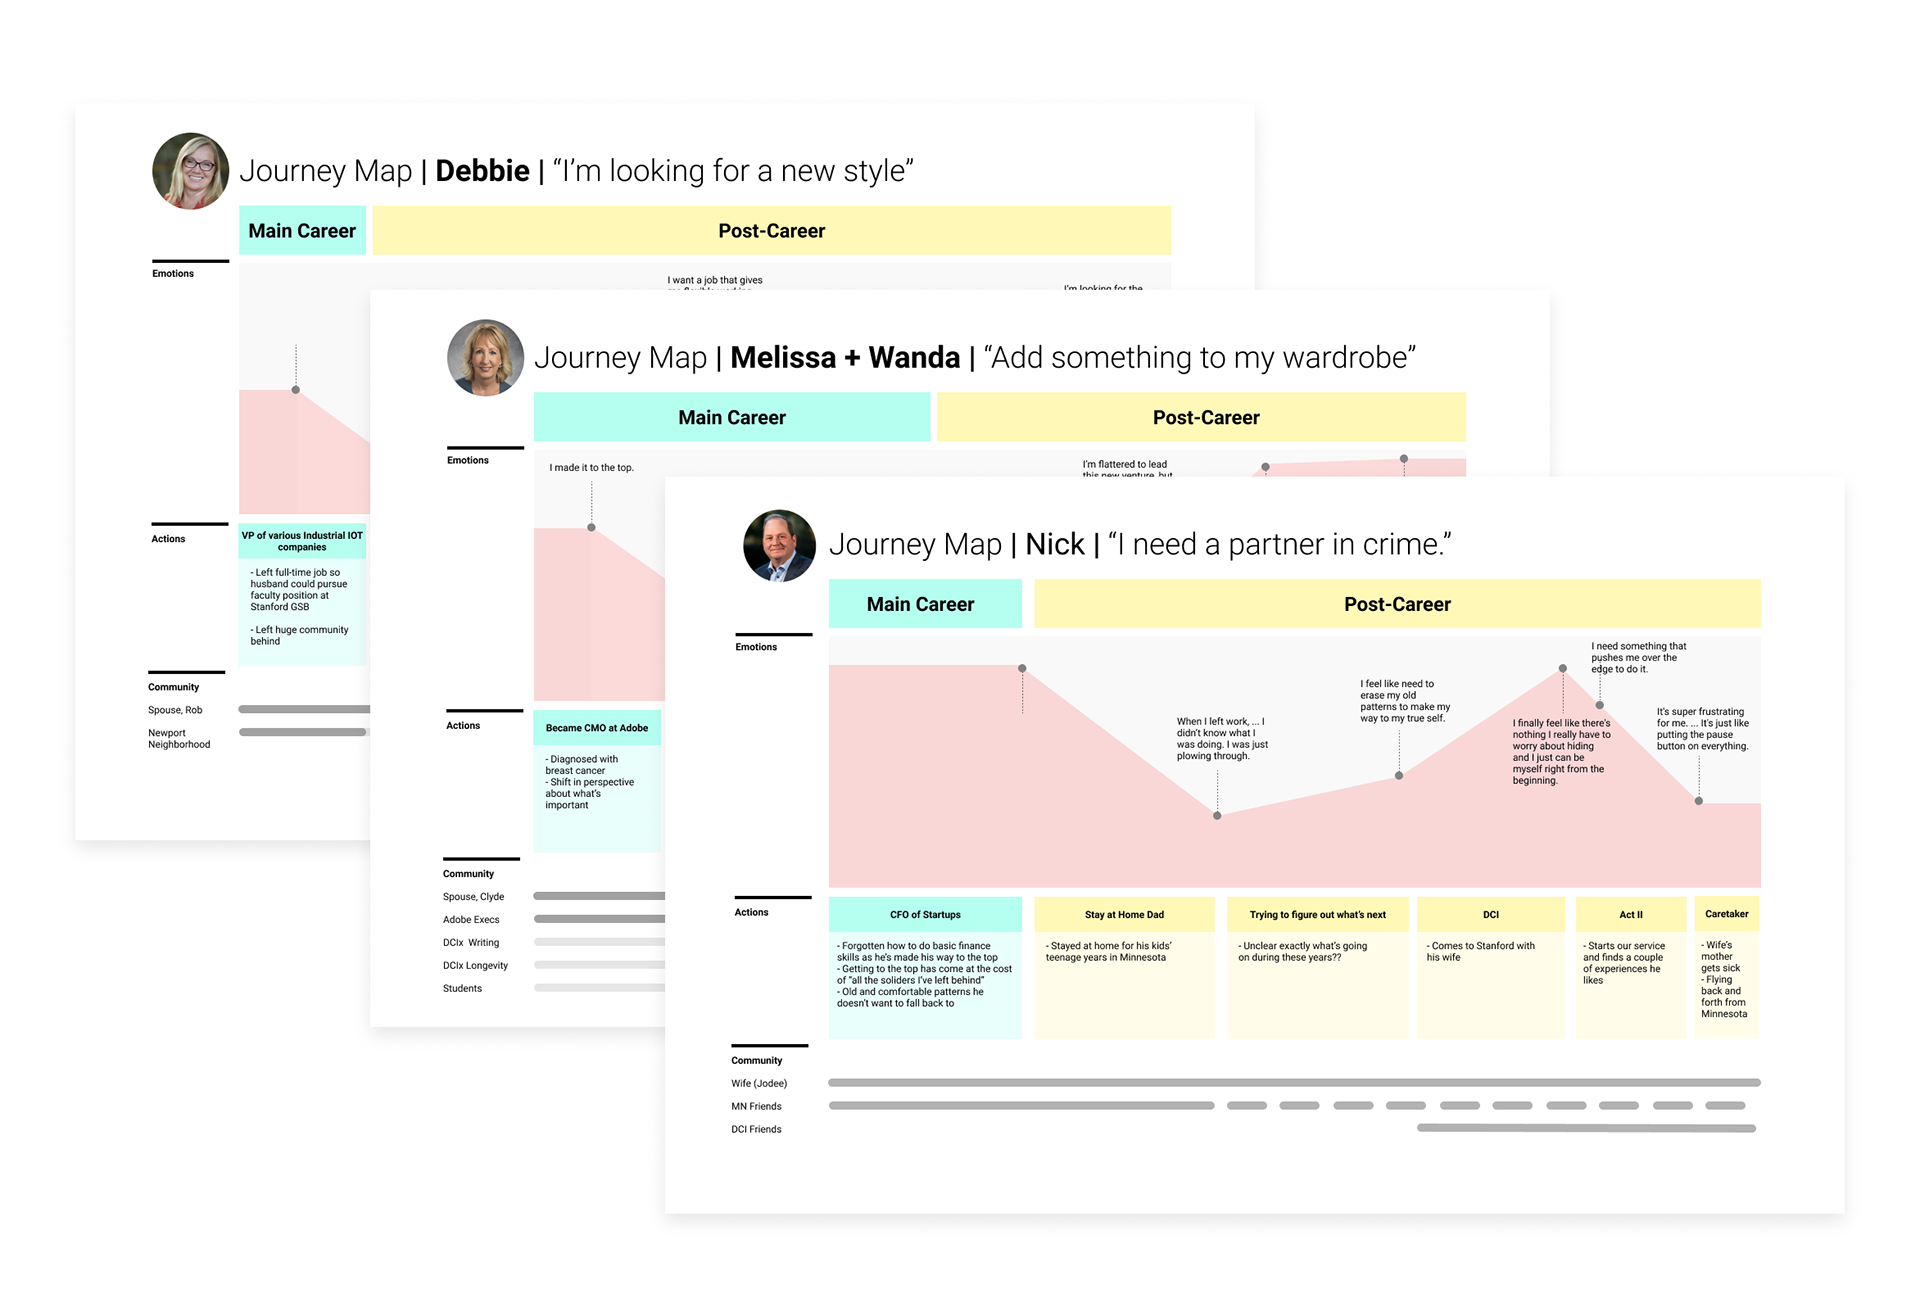
Figure 8: Three personas and their journey maps
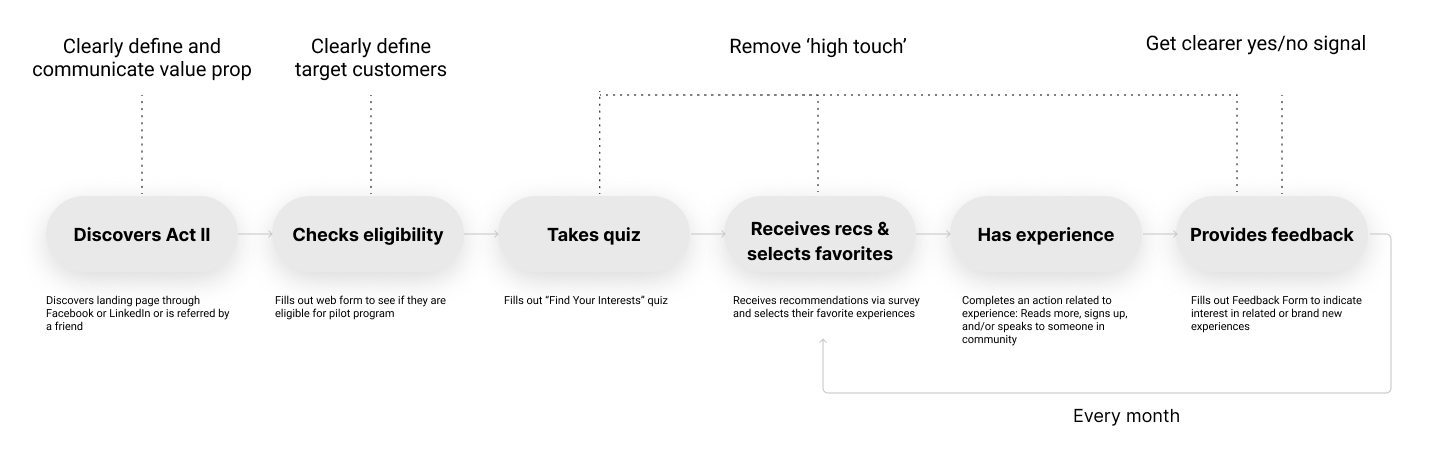
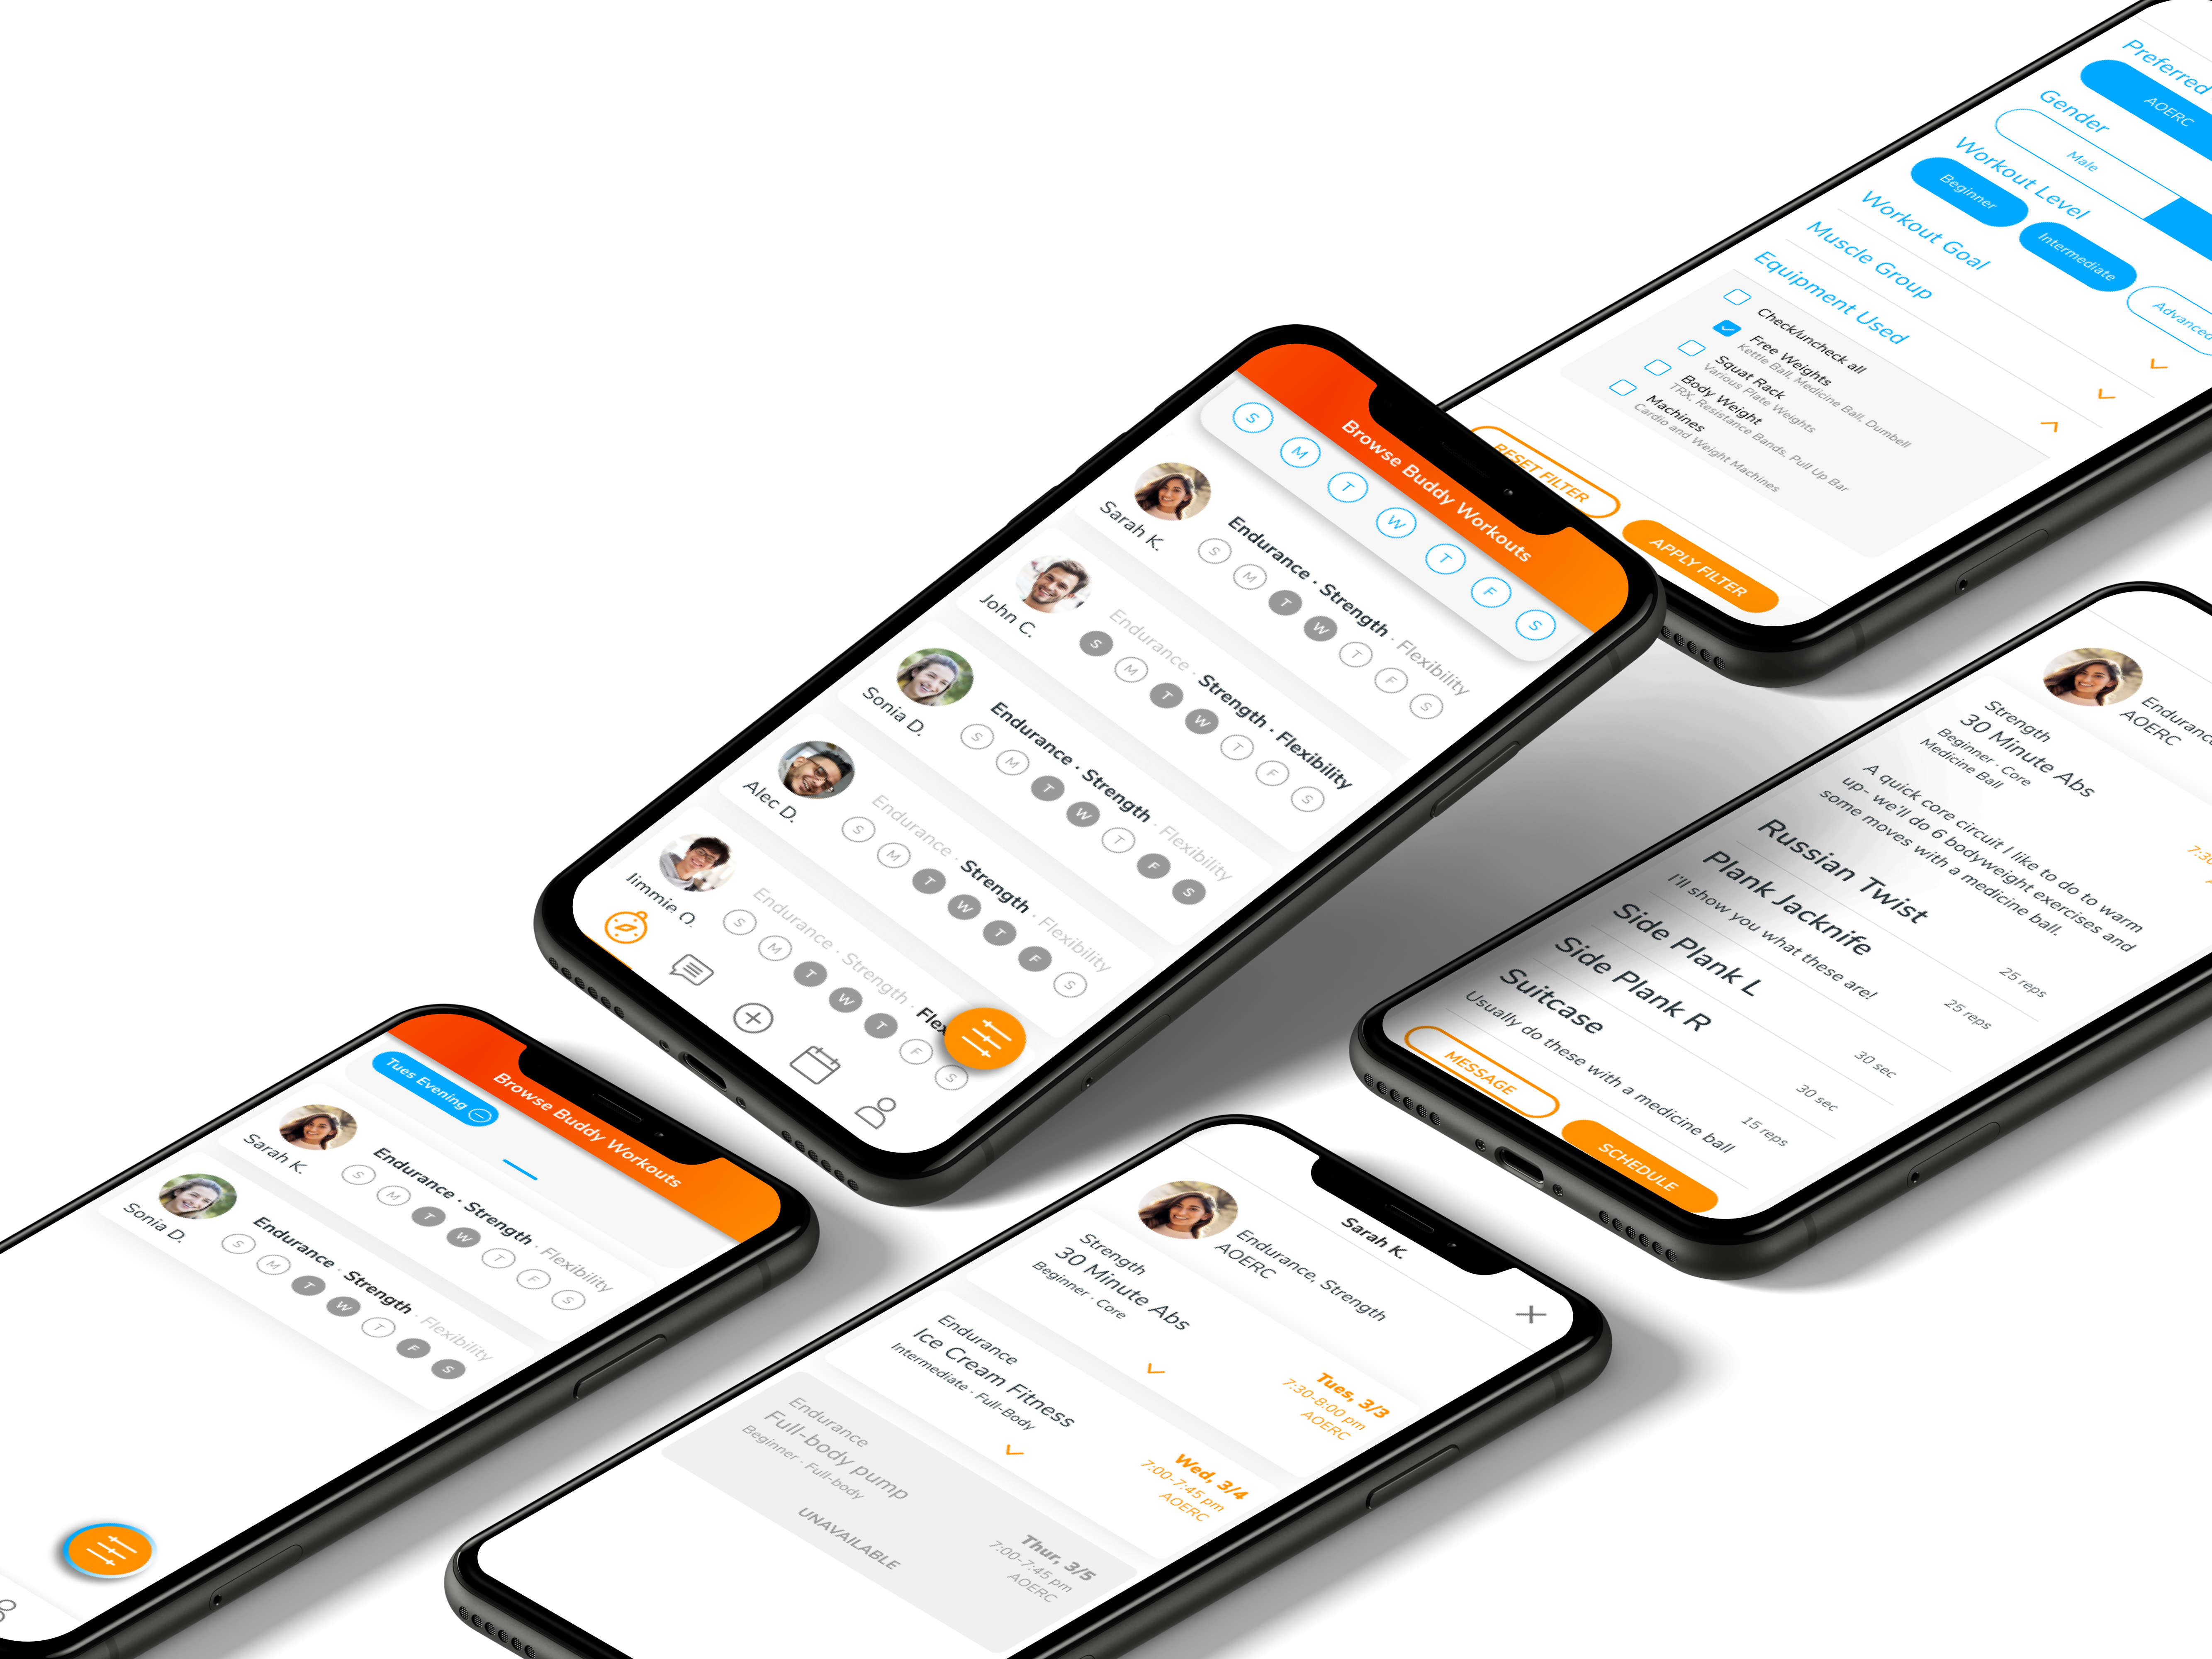
Figure 9: A Minimum Viable Product (MVP) reflecting our value proposition
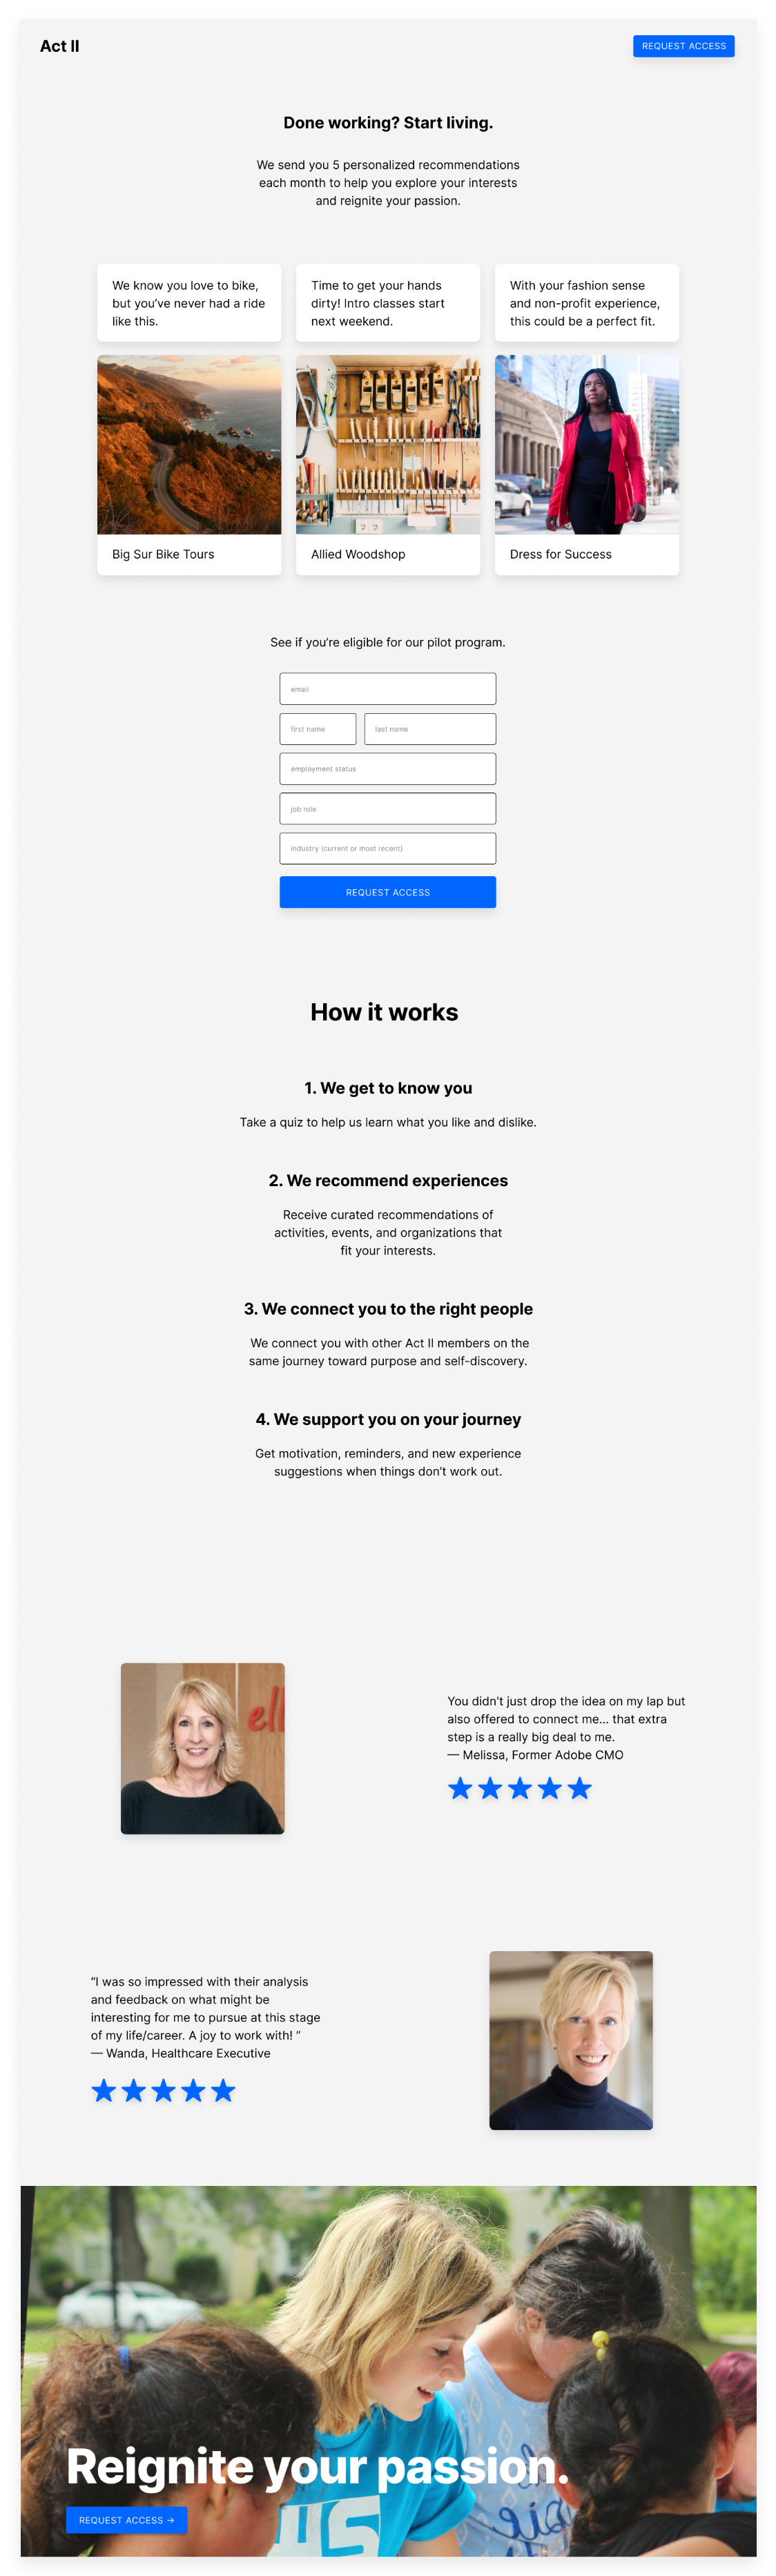
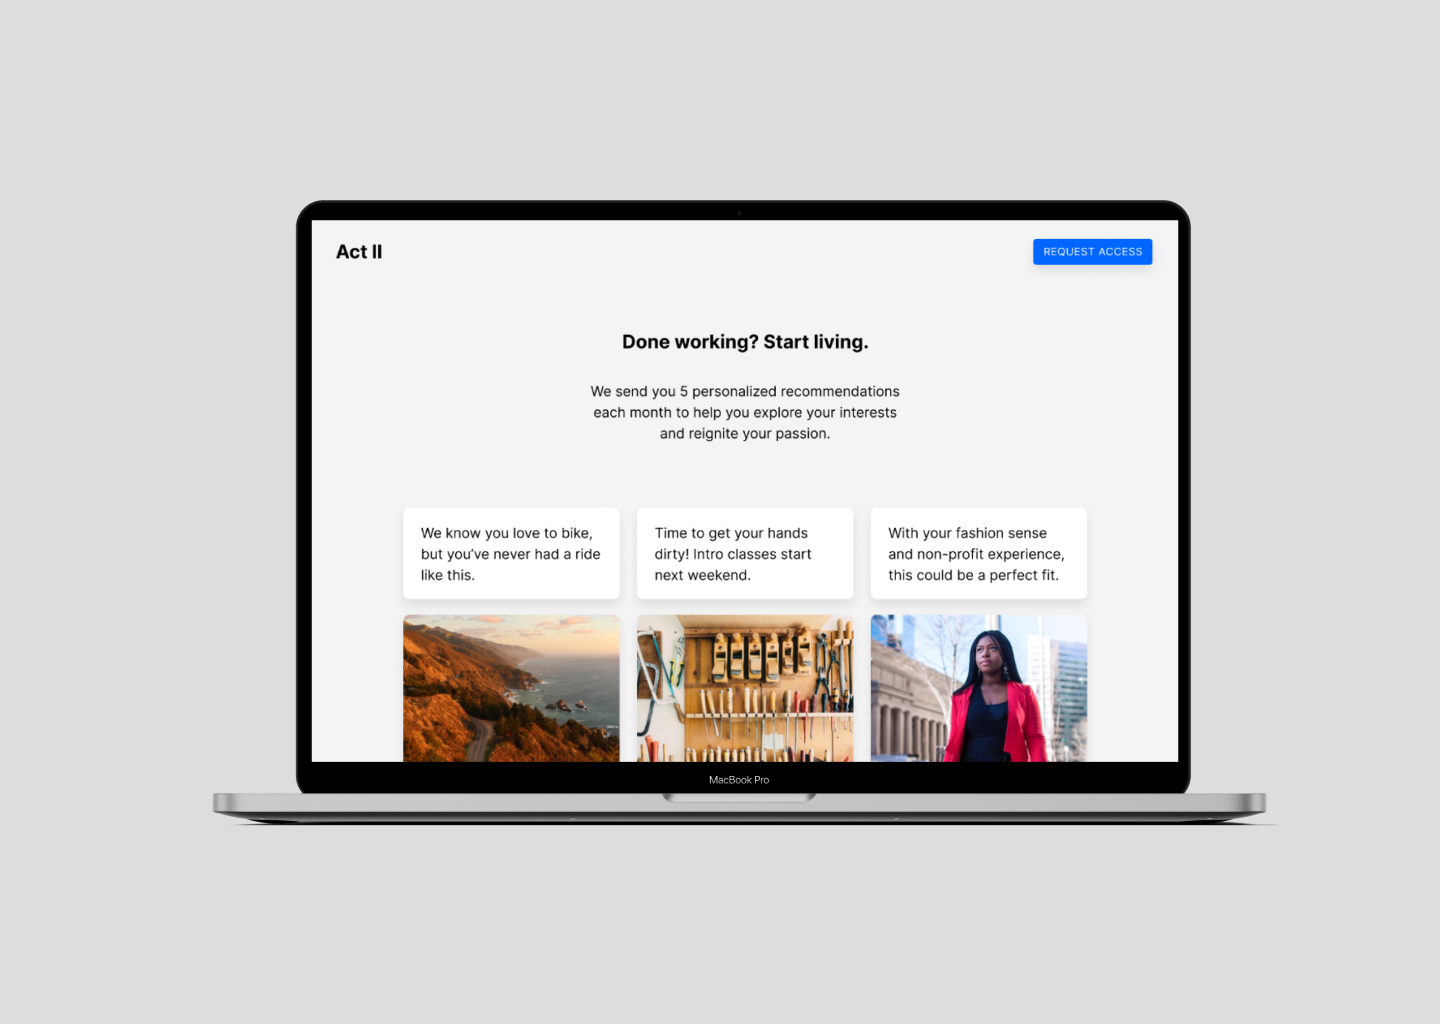
Figure 10: A content mockup of the Act II landing page

Figure 11: I led a team workshop to expand our MVP into a service blueprint and identify opportunities for improvement
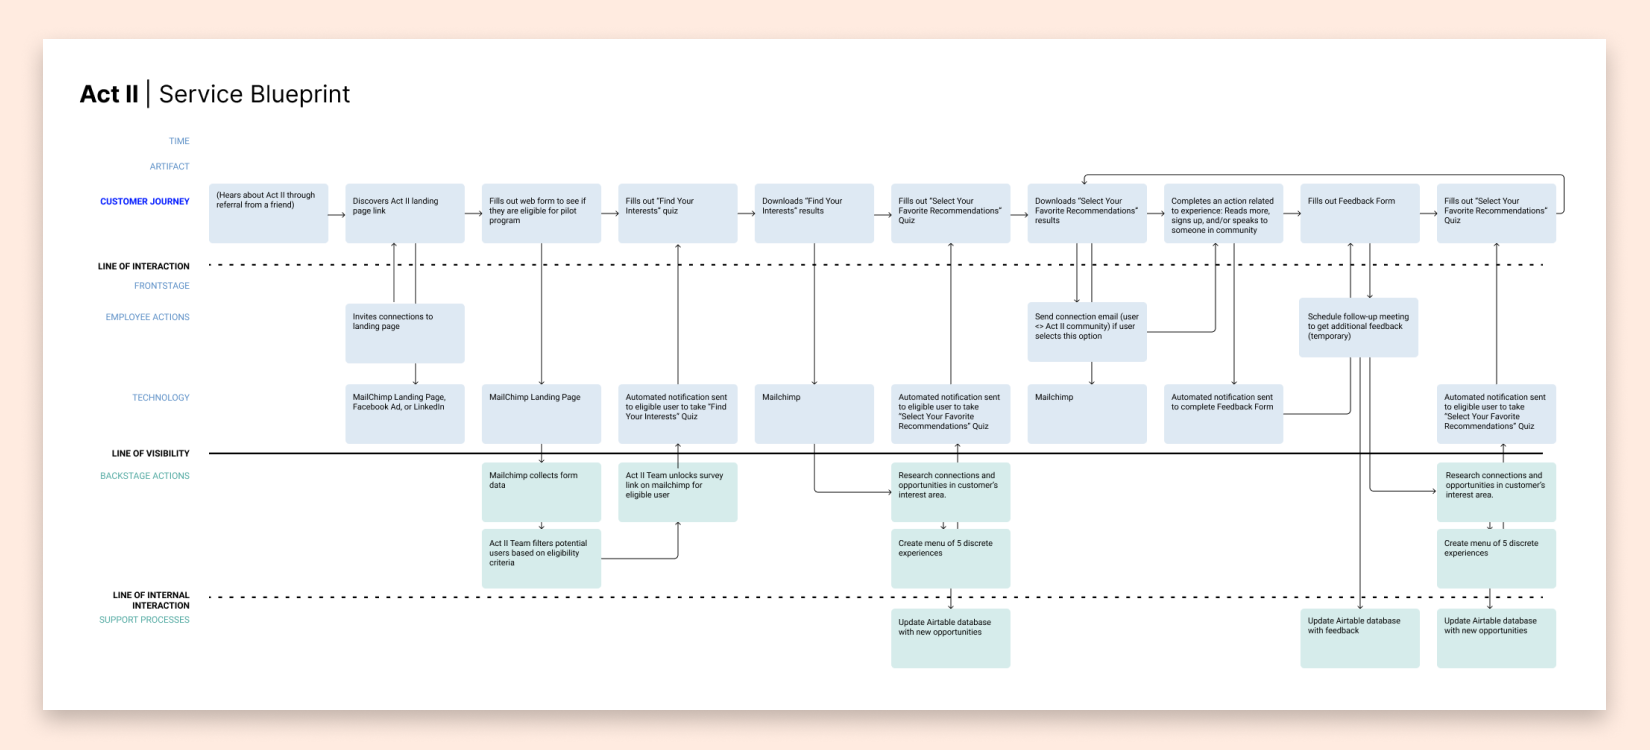
Figure 12: I created a service blueprint to visualize how our backend data analytics map to the user's touch points
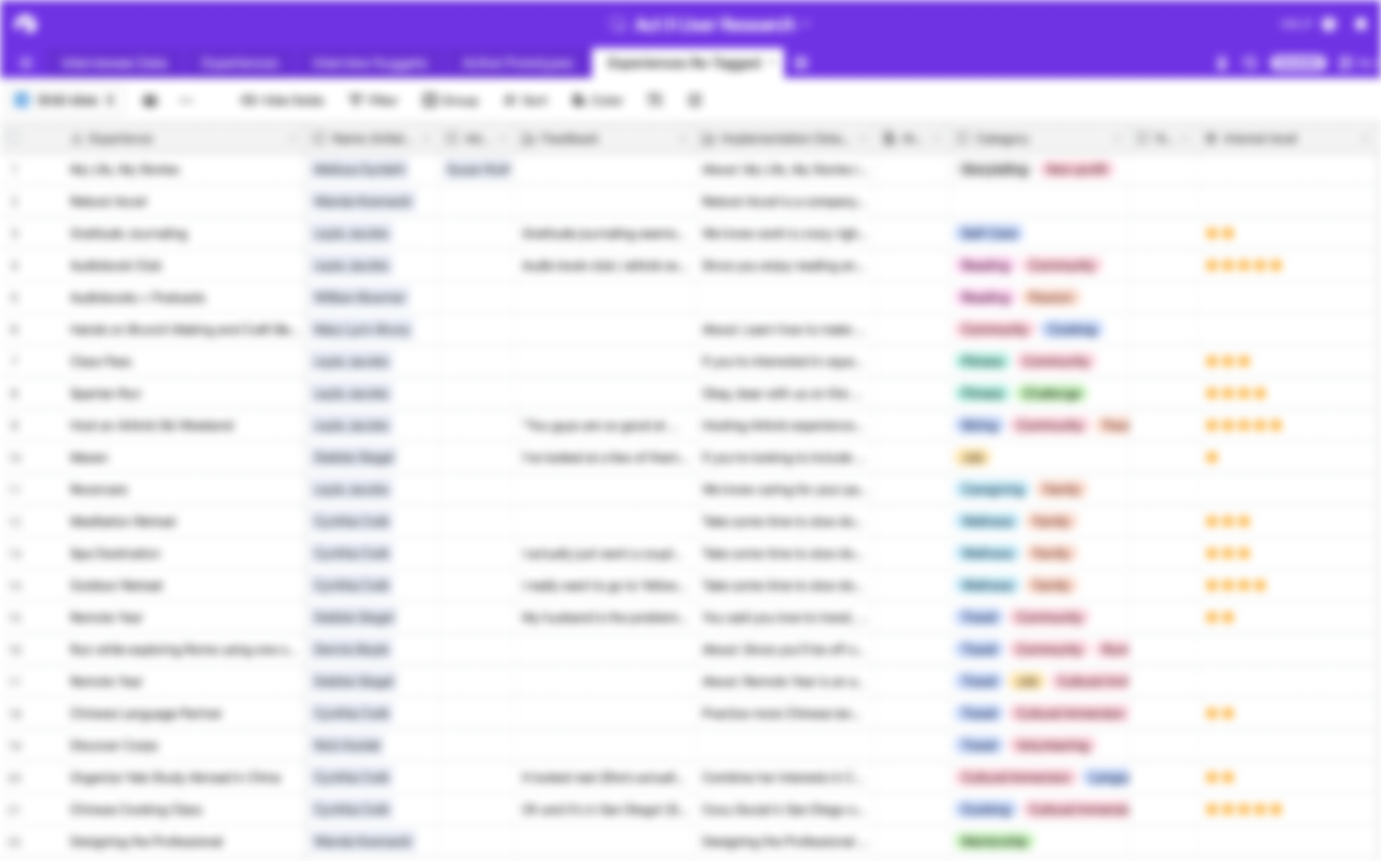
Figure 13: Using Airtable to map our user data, insights, and track KPIs